Since January 1, 2008 until April 30, 2015 the City of Chicago issued 4,723 renovation / alteration building permits for downtown Class A & B office buildings. These permits total $2.56 billion dollars spent on hard construction costs in these office buildings. The data was vetted to only include tenant construction for office space in downtown office buildings. The data does not include base building work completed by the owner or any retail spaces.
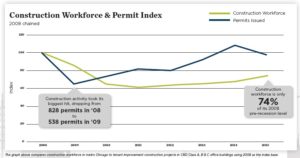
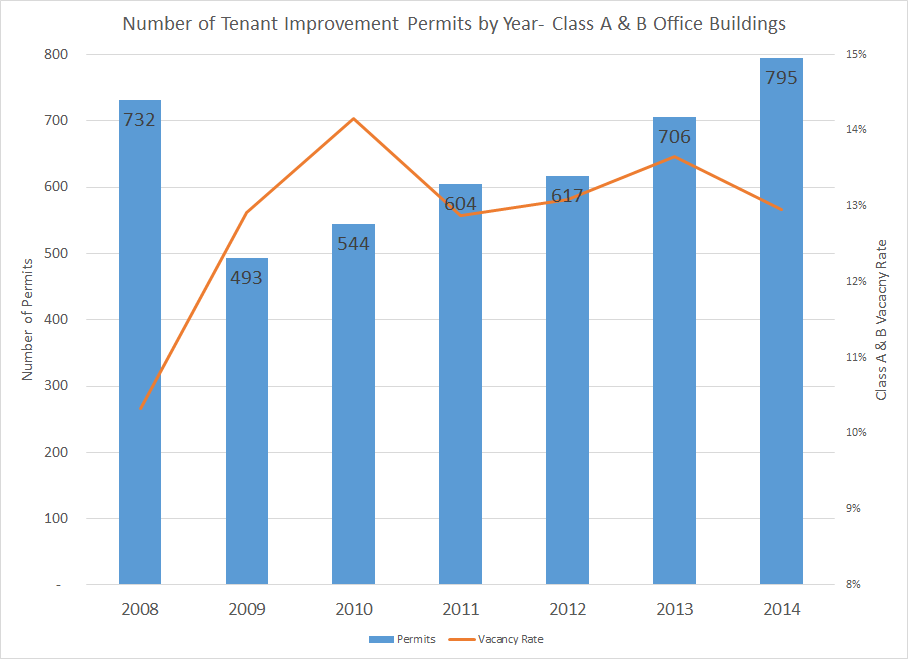
The chart below outlines the number of office space construction permits (known as “Tenant Improvements”) issued per calendar year. In general, the downturn in the number of permits coincided with the Great Recession. The Dow Jones was at 13,044 on Jan 2, 2008 and dropped to 9,035 one year later (Jan 2, 2009). Approximately 3 months later, the Dow Jones dropped to 6,507 (March 9, 2009). Since the bottom in March 2009, the Dow Jones has gradually increased to over 18,000 as of 1Q 2015. The number of Tenant Improvement permits issued for Class A & B office buildings did not recover to pre-recession levels until 2014.
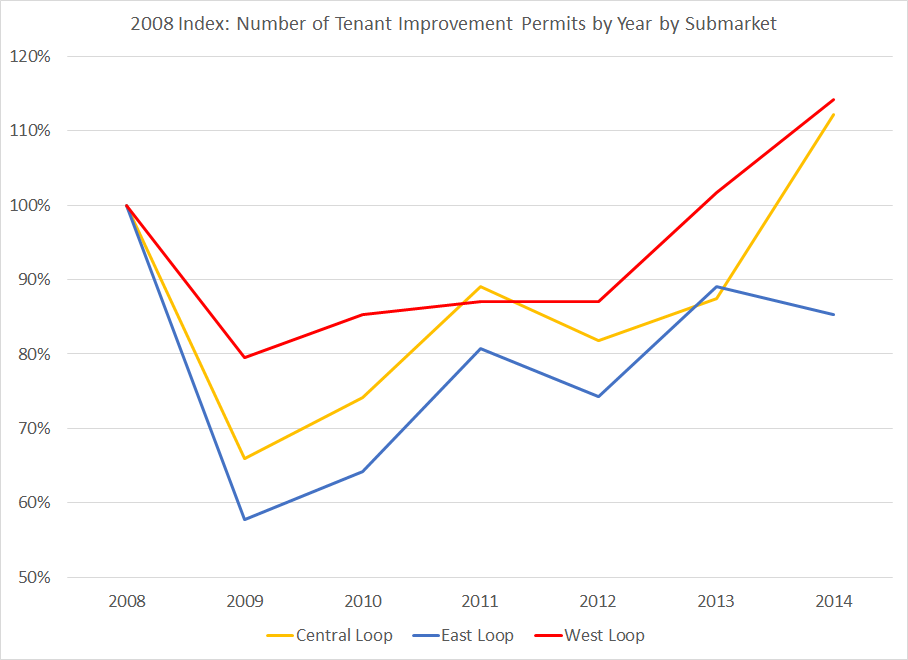
Based on the permit data occurring during the Great Recession, this allows us to see how specific subsections of the office market reacted to the downturn. The charts below are indexed to 2008 permit numbers. The first chart shows permits issued in Class A & B buildings by submarket. As is shown, the West Loop seems to have weathered the Great Recession better than the other two loop submarkets in terms of permits issued as compared to their previous peak.
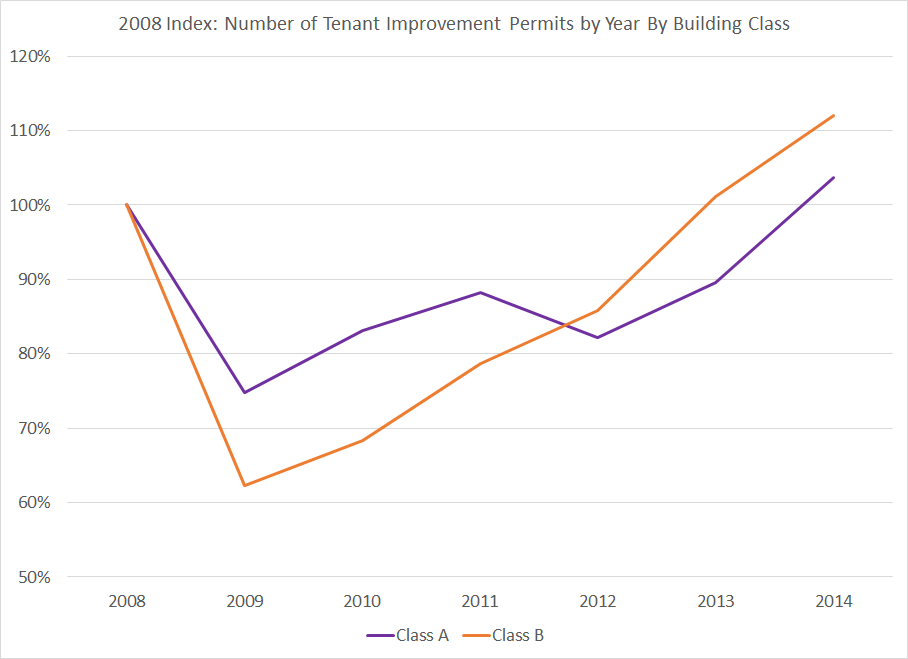
The second charts shows permits issued in the Central Loop, East Loop and West Loop broken down by building class (A or B). Class A buildings did not drop as far as Class B buildings, but Class B buildings have increased the numbers of permits every year since 2009.
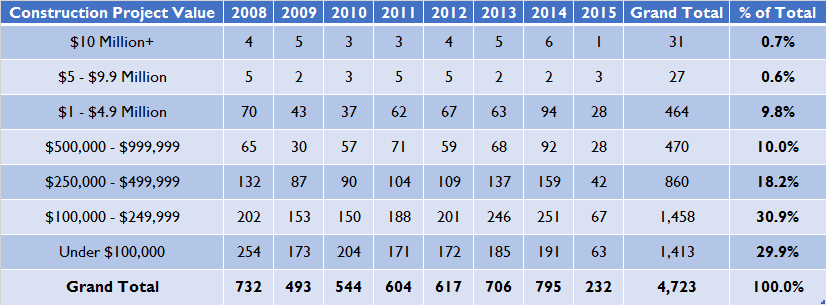
The second part of the permit data is that every permit provides an estimated construction cost number. The charts below outline every tenant improvement permit issued in all submarkets in class A & B buildings broken down by calendar year and estimated construction cost.
This first chart (“Number of Projects”) is a count of the number of permits issued by project value by year.
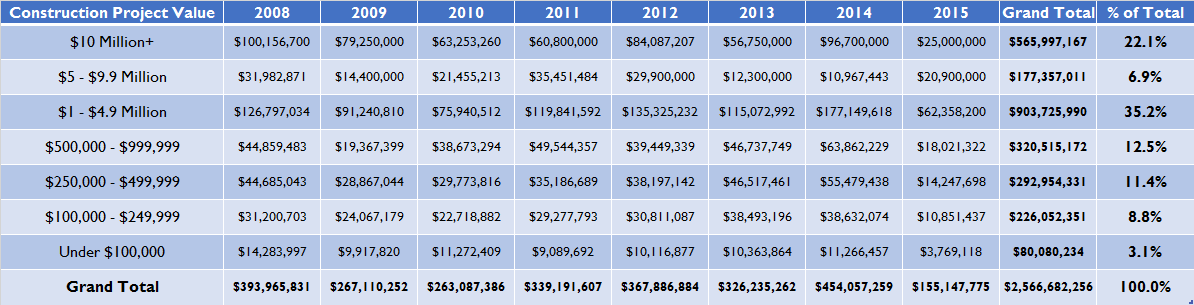
This second chart (“Value of Projects”) is the total construction spend by project value by year.
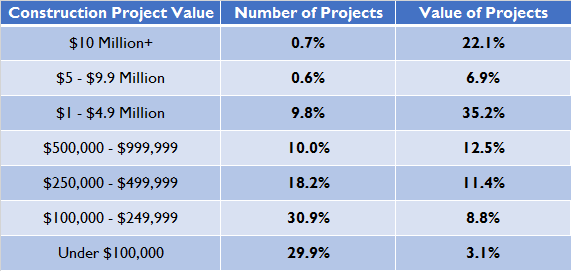
This summary chart outlines the findings of the two previous charts. For example, projects that are valued over $10 million only comprise 0.7% of the total number of permits issued between Jan 1. 2008 – April 30, 2015, but they account for 22.1% of the total construction spend.
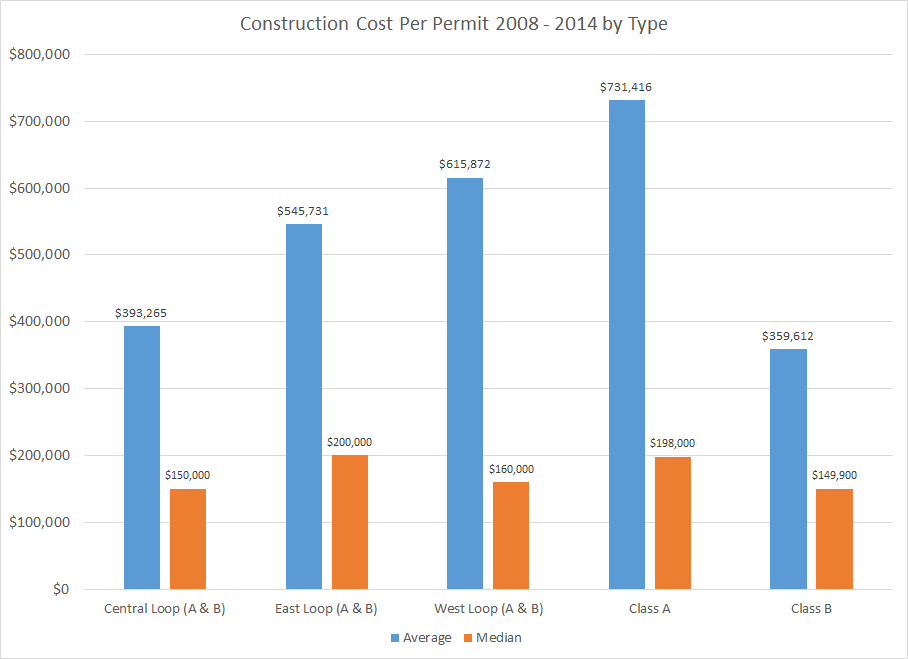
The chart below shows the average estimated construction cost per permit from 2008-2014 broken down by different subsections of the office market.
I believe this permit data is a good indicator of leasing activity in the downtown office market due to the fact that construction projects are usually tied to a lease event (new lease, renewal, relocation, etc.) Almost any construction project requires a permit in Chicago but for minor cosmetic changes to a tenant’s space. This data also provides a different metric for the market rather than the traditional metrics of vacancy rate and asking rental rates. I also believe this analysis is the first time a tenant can understand how the amount of their construction spend benchmarks against all construction projects occurring in office buildings.